Create your own lint rules with custom lint


In this article, we will explore the process of creating custom lint rules with custom_lint. Specifically, we will create a custom lint rule that warns developers when they use print statements in their code and provides a quick fix to replace the print statement with log from the developer package.
Setting up the project
To start creating our own custom lint package, create a new Dart project and add the following dependencies to the project:
- Shell
- Yaml
dart pub add analyzer analyzer_plugin custom_lint_builder
dependencies:
  analyzer: ^6.4.1
  analyzer_plugin: ^0.11.3
  custom_lint_builder: ^0.6.4
Then create a new file custom_lint_example.dart in the lib directory of the project.
import 'package:custom_lint_builder/custom_lint_builder.dart';
PluginBase createPlugin() => _MyCustomLint();
class _MyCustomLint extends PluginBase {
List<LintRule> getLintRules(CustomLintConfigs configs) {
return <LintRule>[
// Your custom lint rules go here
const AvoidPrint(),
];
}
List<Assist> getAssists() {
return <Assist>[
// Your custom assists go here
];
}
}
The createPlugin function is the entry point of our custom lint package. It returns an instance of the _MyCustomLint class, which extends PluginBase.
The _MyCustomLint class implements two methods:
getLintRules: Returns a list of custom lint rules.getAssists: Returns a list of custom assists.
The CustomLintConfigs object is passed to the getLintRules method and contains the configuration for the custom lint rules in the project's analysis_options.yaml file.
With custom_lint, we can create custom lint rules, quick fixes, and assists for Dart and Flutter projects.
- Lint rules: Identifies potential issues in your code.
- Quick fixes: Suggests potential fixes for the issues identified by lints.
- Assists: Provides refactoring and code completion for common tasks such as converting a
StatelessWidgetto aStatefulWidget.
Implementing the lint rule
Let's create a simple lint rule that warns developers when they use print statements in their code.
There is already a built-in lint rule avoid_print available.
Create a new class AvoidPrint that extends DartLintRule. In the constructor, we need to pass a LintCode object that contains the metadata for the lint rule.
import 'package:analyzer/dart/element/element.dart';
import 'package:analyzer/error/error.dart';
import 'package:analyzer/error/listener.dart';
import 'package:custom_lint_builder/custom_lint_builder.dart';
class AvoidPrint extends DartLintRule {
const AvoidPrint()
: super(
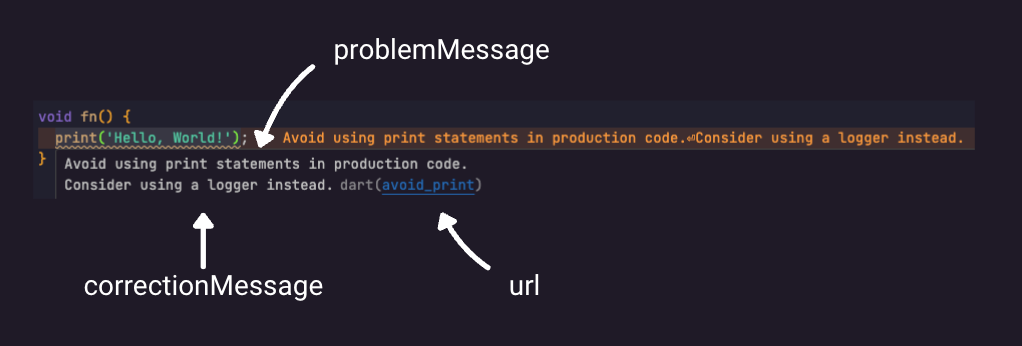
code: const LintCode(
name: 'avoid_print',
problemMessage: 'Avoid using print statements in production code.',
correctionMessage: 'Consider using a logger instead.',
errorSeverity: ErrorSeverity.WARNING,
url: 'https://doc.my-lint-rules.com/lints/avoid_print',
),
);
void run(
CustomLintResolver resolver,
ErrorReporter reporter,
CustomLintContext context,
) {
// Your custom lint rule implementation goes here
}
}
Below are some notable properties of the LintCode object:
- name: The name of the lint rule.
- problemMessage: The message to display when the lint rule is triggered.
- correctionMessage: An optional message to suggest a fix for the lint rule.
- errorSeverity: An optional severity for the lint rule. The default severity is
ErrorSeverity.INFO. - url: An optional URL to link to a documentation page for the lint rule.
To implement the logic for the lint rule, we need to override the run method. The run method takes three parameters:
resolver: ACustomLintResolverobject that provides information about the current file being analyzed.reporter: AnErrorReporterobject that is used to report lint errors.context: ACustomLintContextobject that provides access to the current analysis context.
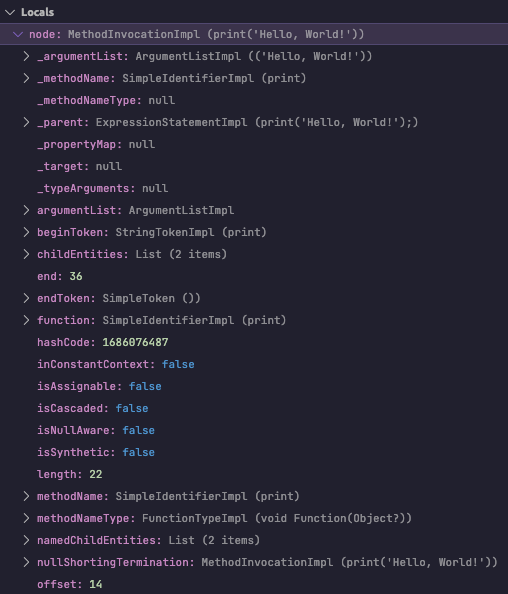
In the run method, we can start by traversing the MethodInvocation nodes in the current file and looking for print statements. The analyzer package provides an AST representation of the Dart code that we can use to analyze the code.
Being familiar with the analyzer package and various AST & Element will be helpful when creating custom lint rules. In our case, we are interested in the MethodInvocation node that represents a method invocation in Dart code.
Here is the signature of MethodInvocation:
methodInvocation ::= (Expression '.')? SimpleIdentifier TypeArgumentList? ArgumentList
To traverse MethodInvocation nodes, we can use the CustomLintContext.registry.addMethodInvocation method, which registers a callback that will be called for each MethodInvocation in the file.
void run(
CustomLintResolver resolver,
ErrorReporter reporter,
CustomLintContext context,
) {
// Register a callback for each method invocation in the file.
context.registry.addMethodInvocation((MethodInvocation node) {
// We get the static element of the method name node.
final Element? element = node.methodName.staticElement;
// Check if the method's element is a FunctionElement.
if (element is! FunctionElement) return;
// Check if the method name is 'print'.
if (element.name != 'print') return;
// Check if the method's library is 'dart:core'.
if (!element.library.isDartCore) return;
// Report the lint error for the method invocation node.
reporter.reportErrorForNode(code, node);
});
}
For each method invocation, we check
- if the method's element is a FunctionElement
- if the method name is
print - if the method's library is
dart:core
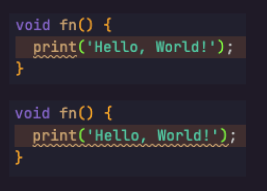
If all conditions are met, we report a lint error using the ErrorReporter object. Here we are using the reportErrorForNode method to report an error for the method invocation node. This will create a squiggly line in the editor that covers the whole method invocation node.
There are also other methods available to report errors:
reportErrorForToken: Reports an error for a specific token.reportErrorForElement: Reports an error for a specific element.reportErrorForOffset: Reports an error for a specific offset in the source code.
In the latest version of analyzer v6.5.0, the above methods are deprecated in favor of atNode, atElement, atToken, and atOffset methods.
Alternatively, we can report the error for the method name node instead of the whole method invocation node, MethodInvocation.methodName is a SimpleIdentifier node which represents the name of the method being invoked.
reporter.reportErrorForNode(code, node.methodName);
The below screenshot shows the difference between reporting an error for the whole method invocation node and only the method name node.
Implementing the quick fix
To implement the quick fix, create a new class UseDeveloperLogFix that extends DartFix. The DartFix class provides a way to apply changes to the source code when a lint rule is triggered.
Similar to the lint rule, we need to override the run method and provide the logic to apply the quick fix. The run method takes the following parameters:
resolver: ACustomLintResolverobject that provides information about the current file being analyzed.reporter: AChangeReporterobject that is used to create a ChangeBuilder to apply the quick fix.context: ACustomLintContextobject that provides access to the current analysis context.analysisError: TheAnalysisErrorobject that triggered the lint rule.others: A list of otherAnalysisErrorobjects in the same file. This can be useful if the quick fix needs to consider other errors in the file.
Similar to the lint rule, we can use the CustomLintContext.registry.addMethodInvocation method to register a callback that will be called for each method invocation in the file.
class UseDeveloperLogFix extends DartFix {
void run(
CustomLintResolver resolver,
ChangeReporter reporter,
CustomLintContext context,
AnalysisError analysisError,
List<AnalysisError> others,
) {
// Register a callback for each method invocation in the file.
context.registry.addMethodInvocation((MethodInvocation node) {
// If the method invocation does not intersect with the analysis error, return.
if (!node.sourceRange.intersects(analysisError.sourceRange)) return;
// Create a ChangeBuilder to apply the quick fix.
// The message is displayed in the quick fix menu.
// The priority determines the order of the quick fixes in the menu.
final ChangeBuilder changeBuilder = reporter.createChangeBuilder(
message: 'Use log from dart:developer instead.',
priority: 80,
);
// Here we use the addDartFileEdit method to apply the quick fix.
changeBuilder.addDartFileEdit((DartFileEditBuilder builder) {
// Get the source range of the method name node.
final SourceRange sourceRange = node.methodName.sourceRange;
// Here we ensure that the developer package is imported.
// It will import the package if it is not already imported.
// If the package is already imported, it will return a ImportLibraryElementResult object.
final ImportLibraryElementResult result = builder.importLibraryElement(Uri.parse('dart:developer'));
// Get the library prefix if the package is imported.
final String? prefix = result.prefix;
// Get the replacement string based on the library prefix.
final String replacement = prefix != null ? '$prefix.log' : 'log';
// Replace the print statement with log.
builder.addSimpleReplacement(sourceRange, replacement);
});
});
}
}
Inside our AvoidPrint class, override the getFixes method and add the UseDeveloperLogFix quick fix.
class AvoidPrint extends DartLintRule {
...
List<Fix> getFixes() => <Fix>[UseDeveloperLogFix()];
}
Now, when the lint rule is triggered, the quick fix will be available in the editor. The quick fix will replace the print statement with log from the developer package. It will also import the developer package if it is not already imported.
RangeFactory
There is an utility class called RangeFactory in the analyzer_plugin package that provides methods to create source ranges based on various syntactic (AST) and semantic (Element) entities.
For example, we can get the source range between the left and right brackets of an IndexExpression node using the startEnd method.
IndexExpression ::= Expression '[' Expression ']'
import 'package:analyzer_plugin/utilities/range_factory.dart';

void fn(IndexExpression node){
  final SourceRange sourceRange = range.startEnd(node.leftBracket, node.rightBracket);
}
Debugging the custom lint rule
Developing custom lint rules can be an iterative process, and it's important to have effective debugging tools. custom_lint provides two ways to debug custom lint rule:
- Print statements
- Dart debugger
Print statements
Using print statements is a simple way to debug the custom lint rule.
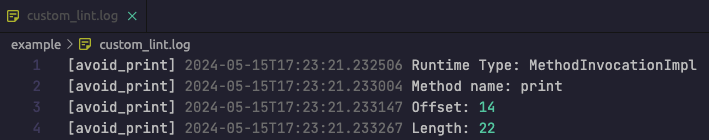
For example, we can add print statements to the run method of the lint rule to print information about the AST nodes being analyzed. The print statements will be displayed in a file called custom_lint.log in the root directory of the project being analyzed.
void run(
CustomLintResolver resolver,
ErrorReporter reporter,
CustomLintContext context,
) {
context.registry.addMethodInvocation((MethodInvocation node) {
print('Runtime Type: ${node.runtimeType}');
print('Method name: ${node.methodName}');
print('Offset: ${node.offset}');
print('Length: ${node.length}');
...
});
}
Dart Debugger
A more advanced way to debug the custom lint rule is to use the Dart debugger which allows you to set breakpoints, inspect variables, and step through the code.
To debug your custom lint rule using the Dart debugger, follow these steps:
- Enable the
debugflag in theanalysis_options.yamlfile of the project being analyzed.
analyzer:
  plugins:
    - custom_lint

custom_lint:
  debug: true
  verbose: true # Optional
- Locate the Dart VM service URL in the
custom_lint.logfile. The first line of the log file contains the Dart VM service URLhttp://127.0.0.1:60804/HT2kfgekXDY=/.
The Dart VM service is listening on http://127.0.0.1:60804/HT2kfgekXDY=/
The Dart DevTools debugger and profiler is available at: http://127.0.0.1:60804/HT2kfgekXDY=/devtools?uri=ws://127.0.0.1:60804/HT2kfgekXDY=/ws
- Attach the debugger to the Dart VM service that is running custom lint.
If you are using Visual Studio Code, open the command palette and type Dart: Attach to Dart Process. Then enter the Dart VM service URL to attach the debugger. This allows you to set breakpoints and debug the custom lint rule.


Learning resources
To learn more about creating custom lint rules with custom_lint, you can check out:
- The source code of riverpod_lint
- The source code of the built-in lint rules in the Dart Linter
- The documentation for the analyzer package
Conclusion
In this article, we explored the process of creating a custom lint rule that warns developers when they use print statements in their code and provides a quick fix to replace the print statement with log from the developer package. You can find the complete example on GitHub.
As we explored the implementation details, we briefly introduced the analyzer package, which are essential in the development of custom lint rules. Additionally, we discussed how to debug custom lint rules using print statements and the Dart debugger.
Creating custom lint rules with custom_lint is relatively straightforward, but it does require familiarity with the analyzer package and various AST nodes.
custom_lint is particularly useful for creating lint rules that are specific to your package. For example, riverpod has its own custom lint rules riverpod_lint that help developers to follow best practices when using Riverpod.
I hope you enjoyed this article and found it helpful. If you have any questions or would like to provide feedback, please feel free to leave a comment below.